The 2022 and 2023 NFL seasons featured a transformed Pro Bowl format which included NFL players participating in flag football games. These competitions featured a 50 yard field, a fixed first down line at the 25, and no special teams plays. Given this new format, previously built NFL metrics/models are likely inappropriate for Pro Bowl flag games. However, using the play by play data from these games, one can recreate two traditional football analytics metrics, expected completion percentage and expected points, for the NFL flag Pro Bowl game.
The first metric is expected completion percentage which describes the chance to complete a pass. A simple expected completion percentage model can be created by fitting whether a pass was completed to air yards (or pass length). There are ~175 pass attempts from the last two Pro Bowls. Results from versions of this model using the Pro Bowl data as well as tackle football regular season are plotted below:
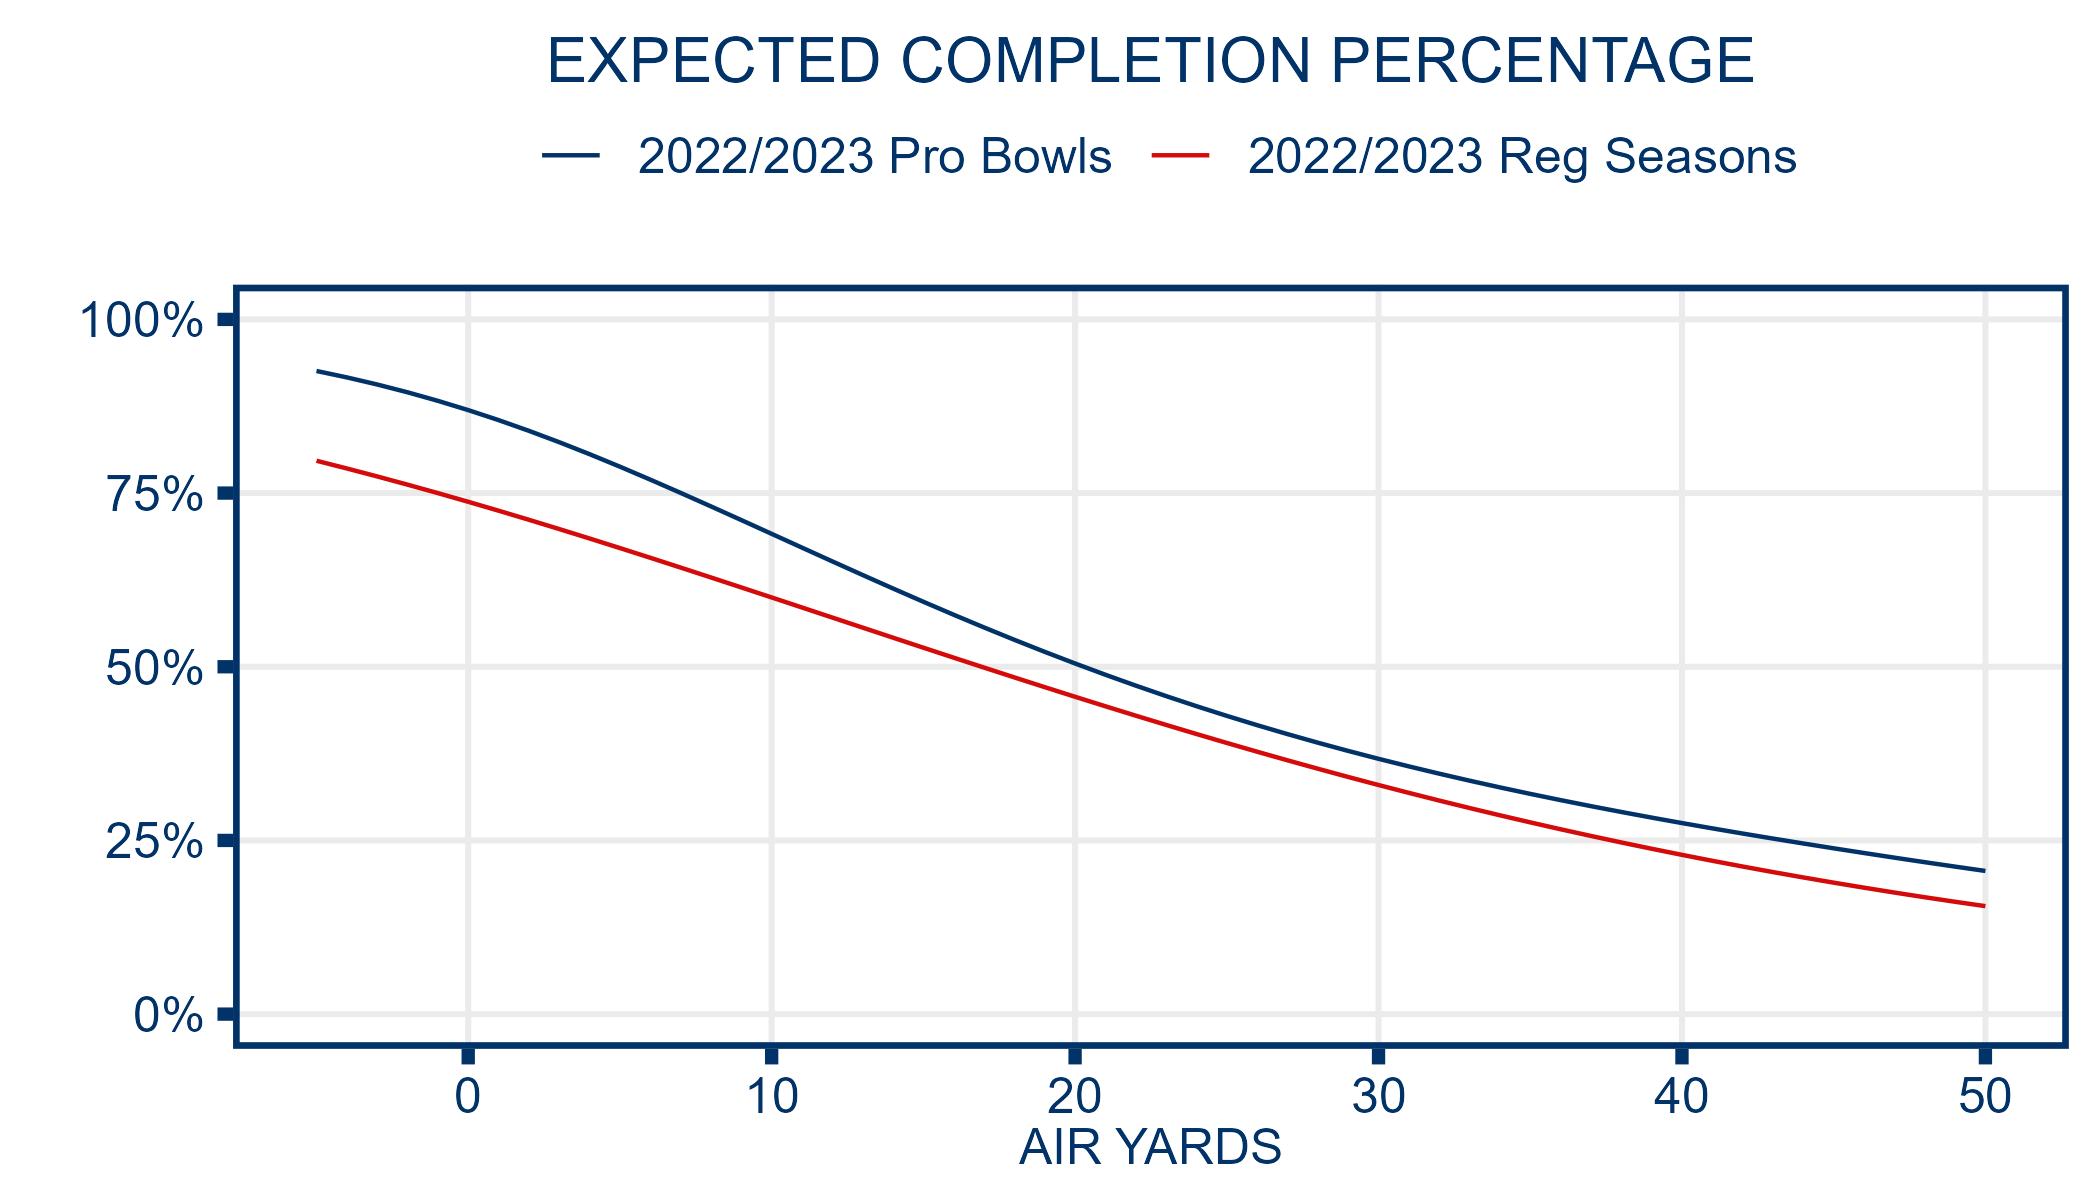
The model results would suggest that completing a pass in the Pro Bowl is easier than in the regular season across all pass lengths. This is unsurprising as the Pro Bowl features restrictions on blitzing and defensive coverages potentially making it easier for the offenses.
The second metric is expected points which is a conversion of field position, down, distance and time remaining into a probabilistic value representing the next points scored by either team. The sign of the value indicates which team (offense or defense) is likely to score next and the magnitude of the value indicates the points they are likely to score on average. For example, an expected points value of -1.3 implies that in expectation, the next points will be scored by the defense at an average 1.3 points.
Using the ~200 non-PAT plays from the last two year’s Pro Bowls, it is possible to fit a simple expected points model using multinomial logistic regression.
Considering field goals are not part of Pro Bowl scoring and a team scoring a safety has not yet been observed, we assume there are three possible outcomes of which team scores next: possession team scores a touchdown, defensive team scores a touchdown, or the half ends. The variables included in this model are:
yard line (from 50 to 1)
time remaining in half
down/distance (down combined with whether line to gain is 25 or goal)
Considering the short field, time remaining did not have a major effect on expected points outside of the final 30 seconds of a half. To account for this, the variable is treated as a spline term with a knot at 30 seconds. Moreover, noisy plays such as turnovers and 4th downs are down-weighted.
A plot showing how expected points changes with field position and down/distance is shown below:
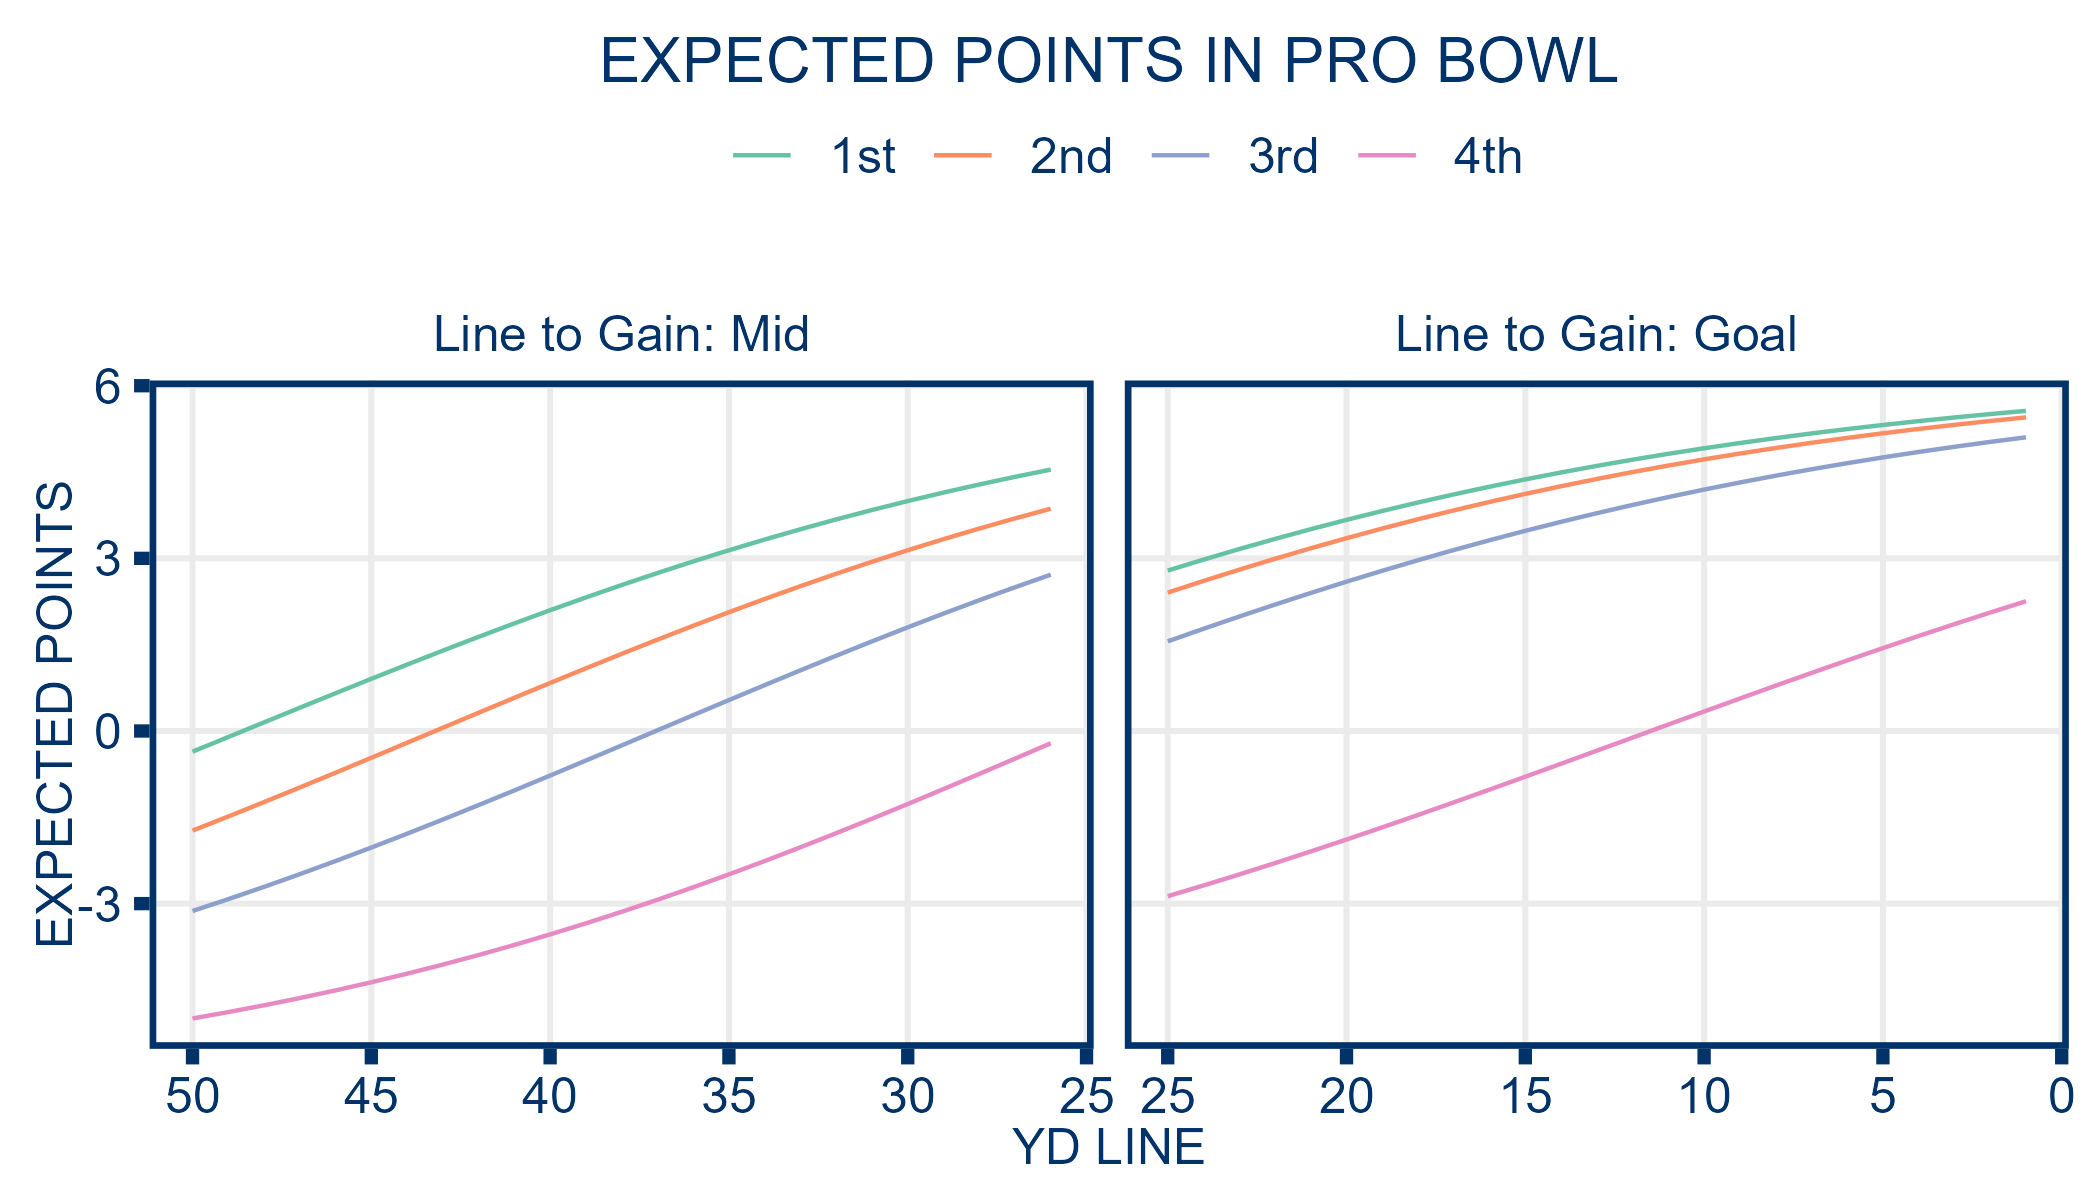
Some observations from the model:
As expected, the lower the down, the higher the expected points and for each distance, the higher the yardline, the higher the expected points.
For each down, it is better to have 1-3 yards to go for a first down from the 26-28 yard line than 25 yards to go for a touchdown from the 25 yard line.
4th down is worse than the other three downs.
Predictions from both these models are often used to measure offensive efficiency. Expected points added is the difference in expected points (or actual points scored) from the expected points of the previous play and can be used to measure how much a play contributed to a team’s scoring chances (the more positive the better). Success Rate is the percentage of plays with a positive EPA and describes how often an offense runs a play which improves their scoring chances (the closer to 100% the better). Completion percentage over expected (or CPOE) is the difference between observed and expected completion percentage and is a way to measure completion rate while accounting for difficulty of throw (the more positive the better).
For each QB, here are the EPA/Play (expected points added per play), Success Rate and CPOE during the last two pro bowls.
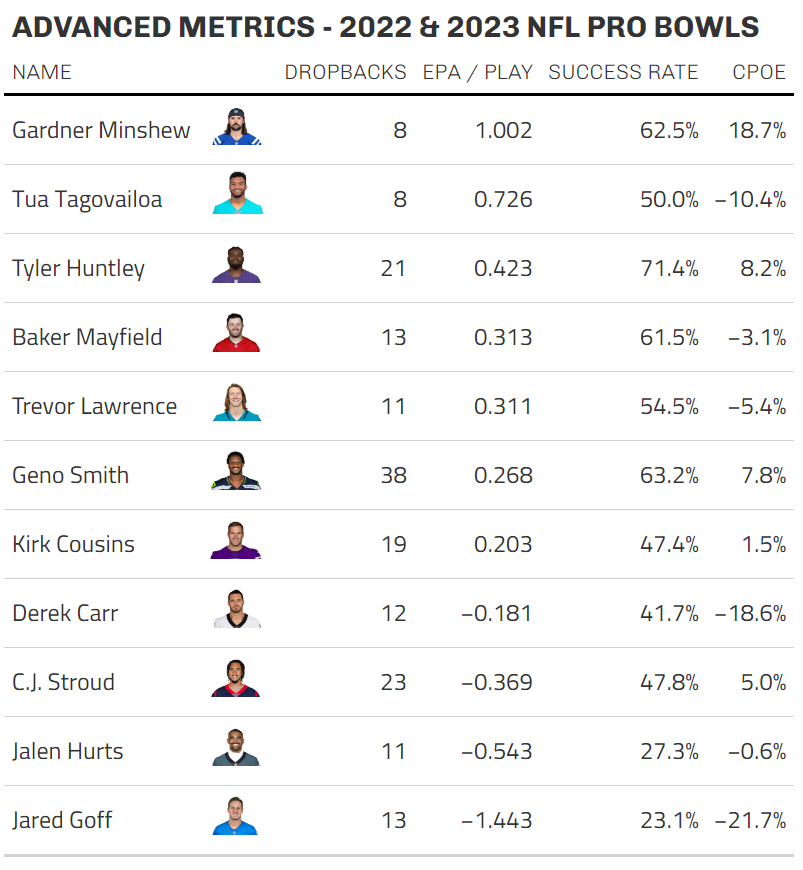
Geno Smith has the largest sample size as he is the only Quarterback to have played in both the 2022 and 2023 Pro Bowls. Gardner Minshew only had 8 dropbacks in the 2023 Pro Bowl, but boasted the highest EPA/play and CPOE at 0.92 points added per play and +18.7% completion percentage respectively. Tyler Huntley’s 21 dropbacks in the 2022 Pro Bowl had the highest success rate across both Pro Bowls at 71.4%. Typical season long EPA/play values for typical NFL play range between -0.3 and 0.3. The small sample size likely contributes to the large outliers.
Ultimately, it is possible to apply traditional tackle football analytics metrics to the NFL Pro Bowl Flag Football game.